

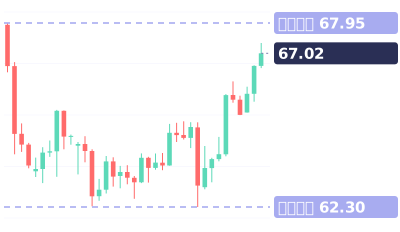
這堂課用的真實 K 線
Real XAGUSD 4-hour chart · Sep 10 – Sep 18
影片最後的小測驗:兩個低點價位相同。該買在第二個低點、等突破頸線,還是再等等?
影片完整旁白(英文原文)
Two lows at the same price. Do you buy now?
Buy the second low or the neckline break? Each has a price.
Silver, 4-hour chart. Low one: 62.32. Low two: 62.30.
The neckline is the high between them, 64.93.
Choice one: buy the second low, near 62.96. Best price, small stop.
But it's not confirmed. Lows can still break.
Choice two: wait for a close above the neckline. Here, 65.74.
It's confirmed, but later. Same stop, about five times the risk.
Either way, your stop goes under the lows, near 62.25.
This time, silver ran to 67.33 the next day.
Save this. Second low: better price, more risk it fails. Neckline close: later, but confirmed. Stop under the lows.
Your turn. Two equal lows. Buy the second low, the neckline break, or wait? Comment below.
Follow for one chart lesson every day.
go dot borearis dot com.
接著看

影片為 AI 配音,內容由 Borearis 研究團隊撰寫審核。僅供學習參考,不構成投資建議,交易有風險。