


這堂課用的真實 K 線
Real XAUUSD 4-hour chart · Sep 11 – Sep 18 · quiz: XAGUSD 4-hour
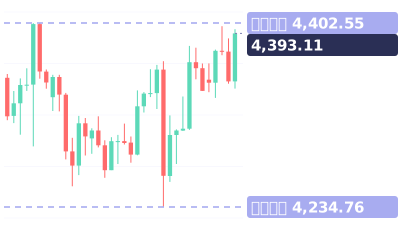
影片最後的小測驗:白銀刺穿支撐後又拉回來,這樣算突破了嗎?
影片完整旁白(英文原文)
Price broke support by a hair, then shot up.
Support isn't a line. Treat it like a zone and this stops hurting you.
Real gold 4-hour chart, mid-September. Gold bounced here twice.
Step one: don't draw one thin line. Mark the whole area where price turned.
Here, that's roughly 4,254 to 4,272.
Step two: small pokes through the zone are normal. Stops get hunted there.
On September 17, gold dipped to 4,235, then closed back inside at 4,263.
A line said broken. The zone said: still holding.
Next day, gold reached nearly 4,400.
Step three: only a close well beyond the zone counts as a break.
Save this. Support is a zone. Pokes are normal. Only a close beyond it is a break.
Your turn. Silver poked below support and came back. Broken or not? Comment below.
Follow for one chart lesson every day.
go dot borearis dot com.
接著看



影片為 AI 配音,內容由 Borearis 研究團隊撰寫審核。僅供學習參考,不構成投資建議,交易有風險。