


這堂課用的真實 K 線
Real XAUUSD 4-hour chart · Jul 23 – Aug 7 · quiz: EURUSD 4-hour
影片最後的小測驗:歐元又來到區間頂部。該做空、等突破後追多,還是先觀望?
影片完整旁白(英文原文)
Price hit the range top again. Do you sell?
Sell blindly and the breakout runs you over. Here's when it's worth it.
Free daily picks in our app, link in bio.
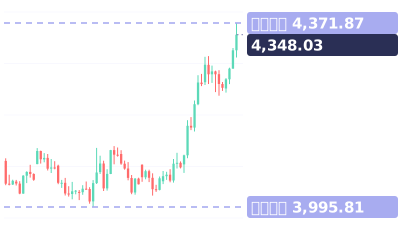
Real gold 4-hour chart. The range top sat near 4,116.
Rule one: every touch rejected with a wick? Selling makes sense. Stop above the top.
Here, two wicks got rejected, and gold dropped back to about 4,020.
Rule two: touches getting closer together? A break is coming. Stop selling.
Rule three: a candle closes above the top. The range is over. Don't short.
On August 5, gold closed at 4,162, then ran to 4,372.
Save this. Wicks rejected: sell, stop above. Touches speeding up: wait. Close above: don't short.
Your turn. Euro at the range top again. Sell, buy the break, or wait? Comment below.
Follow for one chart lesson every day.
go dot borearis dot com.
接著看
影片為 AI 配音,內容由 Borearis 研究團隊撰寫審核。僅供學習參考,不構成投資建議,交易有風險。