
突破失败了,然后呢?
突破失败了,大部分人在这里放弃。但失败的突破常常是反方向的机会。
- 步骤 1:有 K 线收盘回到区间内。这次突破失败了。
- 步骤 2:追突破的交易者被套住。他们的出场会把价格推向另一边。
- 步骤 3:往区间的另一侧交易。止损放在失败的那个极值之外。
- 如果价格又收盘回到区间外,这个形态就错了。赶快出场。


这堂课用的真实 K 线
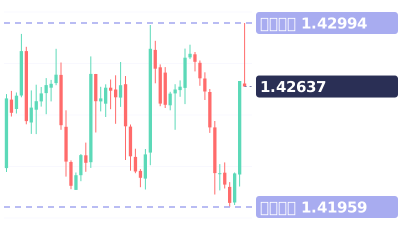
Real USDCAD 4-hour chart · Oct 2 – Oct 14
视频最后的小测验:价格突破区间上方,然后收盘又回到区间内。该买、该卖,还是先观望?
视频完整旁白(英文原文)
The breakout failed. Most traders give up here.
But a failed breakout is often a trade the other way.
This is the US dollar against the Canadian dollar, four-hour chart. For more than a week, it ranged between 1.4203 and 1.4298.
Then this candle closed below the range. Sellers jumped on the breakdown.
So, buy, sell, or wait? Run three steps.
Step one: the next candle closed back inside the range. That's the failure.
Step two: the sellers who shorted the break are now trapped, and their stops sit above.
When those stops get hit, they have to buy. That pushes price toward the other side.
Step three: buy the close back inside. Stop under the failed low at 1.4196. Target the range top.
So the answer: buy.
Here's what happened. The next candle shot up to 1.4267, and the one after hit 1.4299.
That's the top of the range, in just two candles.
One warning: if price closes back outside the range again, the setup is wrong. Get out.
Save this. Close back inside: the break failed. Trade toward the other side. Stop beyond the failed extreme.
Your turn. Price breaks above a range, then closes back inside. Buy, sell, or wait? Comment below.
Follow for one chart lesson every day.
go dot borearis dot com.
接着看




视频为 AI 配音,内容由 Borearis 研究团队撰写审核。仅供学习参考,不构成投资建议,交易有风险。