
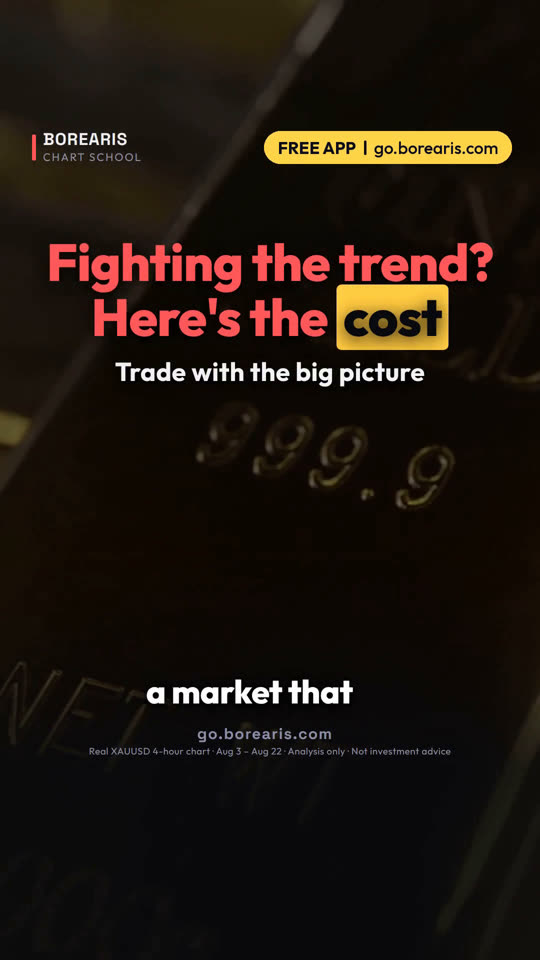

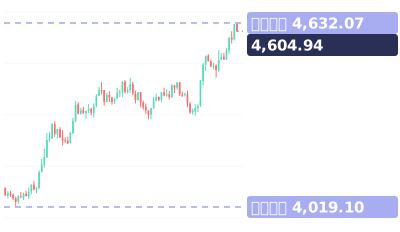
这堂课用的真实 K 线
Real XAUUSD 4-hour chart · Aug 3 – Aug 22
视频最后的小测验:你有没有逆着强趋势做过单:从来没有、只有一次,还是经常?
视频完整旁白(英文原文)
You keep selling a market that keeps going up.
Every short looks right. Then it isn't.
Real gold chart, 4-hour candles, from August 3 to August 22.
Short one: a big red candle on August 6. Sell at 4260, stop above the high at 4310.
It dropped to 4223. Looked right. Then it ran to 4371. Stopped out.
Short two, August 11. Another big red candle. Sell 4370, stop 4440. Stopped again.
Short three, August 18. Sell 4365. It fell to 4324, then hit 4440.
Three shorts, three stops. 195 dollars of price against you.
Gold, 1 standard lot: price moves 1 dollar, that's 100 dollars. At 0.1 lots, 1,950 dollars lost.
Meanwhile, gold climbed from about 4020 to over 4600.
Rule one: check the trend before every trade. Higher highs and higher lows means up.
Rule two: a trade against the trend needs a much better reason than one red candle.
Rule three: when in doubt, trade with the trend, or wait.
Save this. Check the trend first. Against it? Need a strong reason. In doubt? Go with it, or wait.
Your turn. Ever fought a strong trend? Never, once, or all the time? Comment below.
Follow for one chart lesson every day.
go dot borearis dot com.
接着看




视频为 AI 配音,内容由 Borearis 研究团队撰写审核。仅供学习参考,不构成投资建议,交易有风险。