
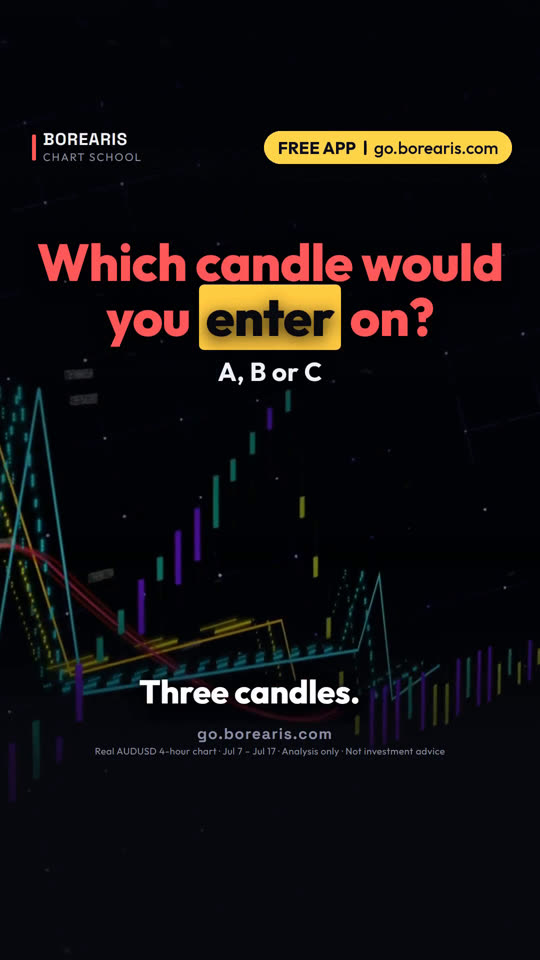
你会在哪根 K 线进场?
三根 K 线,只有一根是好的进场点。你会选哪一根?
- A:还在往支撑下跌。没有确认,也没有明确的止损位。
- C:离支撑太远。追在行情中段进场,代表止损要拉很宽。
- B:测试支撑后,收盘价站上前面两根 K 线的高点。贴近关键价位,止损明确。
- 等确认出现,在关键价位附近进场,买之前先想清楚止损在哪里。


这堂课用的真实 K 线
Real AUDUSD 4-hour chart · Jul 7 – Jul 17
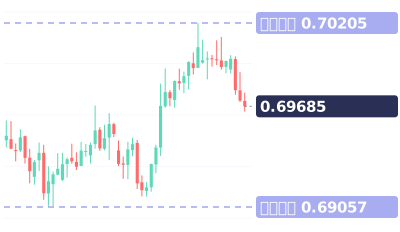
视频最后的小测验:一根大阳线收在关键价位上方很远的地方。你会进场、等回调,还是跳过?
视频完整旁白(英文原文)
Three candles. Only one is a good entry.
Which one would you pick?
This is the Aussie dollar, four-hour chart. Support near 0.6906 held the week before.
Candle A: a big red candle, still falling into support. Nothing says the drop is over.
Buy here and you're guessing. Where does your stop go? You don't know yet.
Candle C: a big green candle, far above support. You'd be chasing the middle of the move.
Your stop would have to sit under support. That's a lot of risk for one trade.
Candle B: price tested support, then this green candle closed above the last two highs.
That's confirmation. It's near the level, and the stop is clear: just under the low at 0.6912.
So the answer is B.
Here's what happened. Within two days, the Aussie climbed to 0.70205.
Then it pulled back to 0.69653, below candle C's close. B was still in profit.
Save this. Wait for a candle that confirms. Enter near the level. Know your stop before you buy.
Your turn. A huge green candle closes far above the level. Enter, wait for a pullback, or skip? Comment below.
Follow for one chart lesson every day.
go dot borearis dot com.
接着看



视频为 AI 配音,内容由 Borearis 研究团队撰写审核。仅供学习参考,不构成投资建议,交易有风险。