

下一根 K 线,涨还是跌?
猜猜下一根 K 线是涨是跌?这不是运气,前后的情况会给你优势。
- 问题 1:价格在哪里?在关键价位,还是在区间中间?
- 问题 2:最后几根 K 线在那里做了什么?长影线代表受到拒绝。
- 价位加上拒绝,等于一个优势,不是保证。
- 在区间中间、K 线混乱:不交易。


这堂课用的真实 K 线
Real USDJPY 4-hour chart · Sep 18 – Oct 1 · quiz: GBPUSD 1-hour
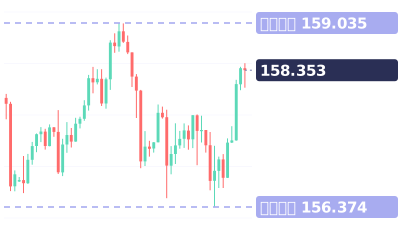
视频最后的小测验:这里是英镑。下一根 K 线:向上、向下,还是完全没想法?
视频完整旁白(英文原文)
Guess the next candle: up or down?
It's not luck. The context gives you an edge.
Real US dollar to yen chart, 4-hour, September 30.
Question one: where is price? At a level, or in the middle?
Here, it's on support near 156.50. It held there twice before.
Question two: what did the last candles do there?
A long lower wick. Sellers pushed it down, buyers pushed it right back.
A level plus rejection. That's an edge, not a promise.
The next candle closed higher, and on October 1 it hit 158.45.
In the middle of a range, with mixed candles? The right answer is: no trade.
Save this. At a level, with rejection: you have an edge. In the middle: no trade.
Your turn. Here's the pound. Next candle: up, down, or no idea? Comment below.
Follow for one chart lesson every day.
go dot borearis dot com.
接着看


视频为 AI 配音,内容由 Borearis 研究团队撰写审核。仅供学习参考,不构成投资建议,交易有风险。