

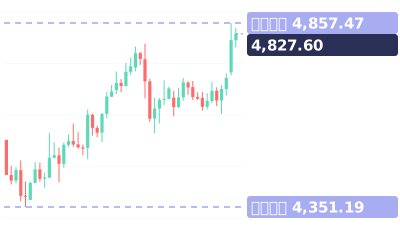
这堂课用的真实 K 线
Real XAUUSD 4-hour chart · Mar 26 – Apr 8 · quiz: AUDUSD 1-hour Oct 23 – Oct 26
视频最后的小测验:回调到一半了。该买入、先等,还是卖出?
视频完整旁白(英文原文)
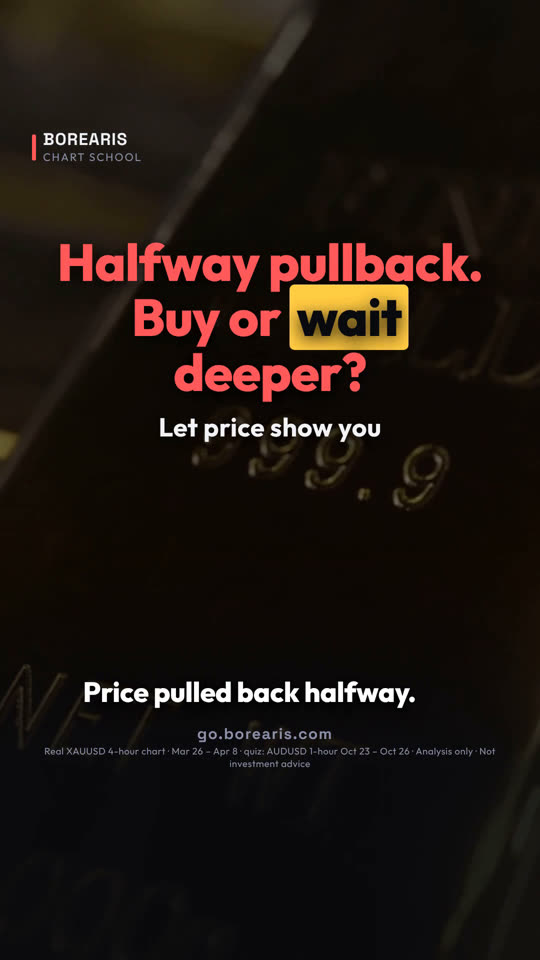
Price pulled back halfway. Is it time to buy?
Some pullbacks stop here, some go deeper. One sign tells you which.
Real gold, 4-hour chart. A run from 4,351 to 4,800.
Halfway back is about 4,576. A common pause, not a promise.
The first candle there closed red, near its low. No reaction. Wait.
The next one dipped to 4,554, then closed green at 4,622. That's the sign.
Buy that close, with your stop under 4,554.
Gold went on to 4,857 by April 8.
No green close at halfway? Don't guess. Wait for the next level down.
Save this. Halfway: a pause, not a promise. Green close: buy, stop under the swing. No reaction: wait lower.
Your turn. Pullback reached halfway. Buy, wait, or sell? Comment below.
Follow for one chart lesson every day.
go dot borearis dot com.
接着看


视频为 AI 配音,内容由 Borearis 研究团队撰写审核。仅供学习参考,不构成投资建议,交易有风险。