
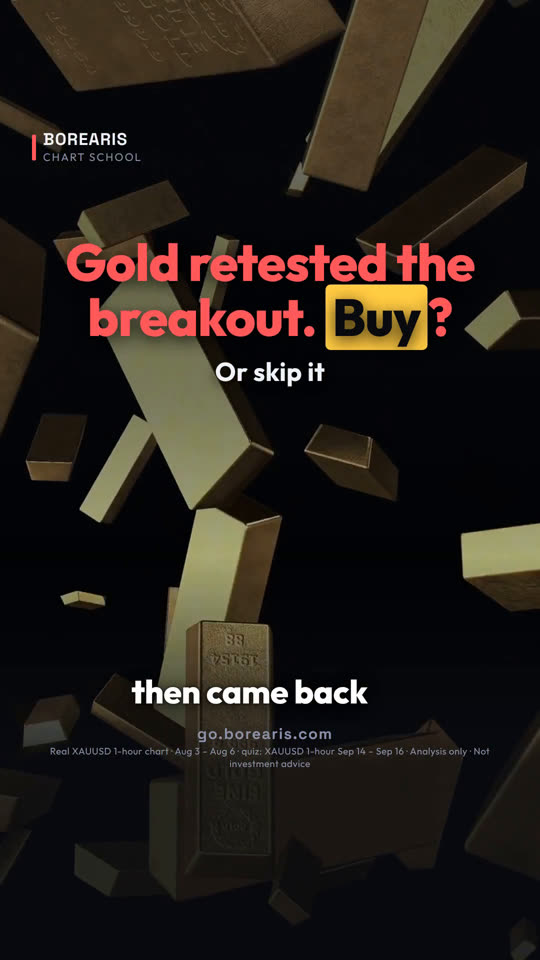

这堂课用的真实 K 线
Real XAUUSD 1-hour chart · Aug 3 – Aug 6 · quiz: XAUUSD 1-hour Sep 14 – Sep 16
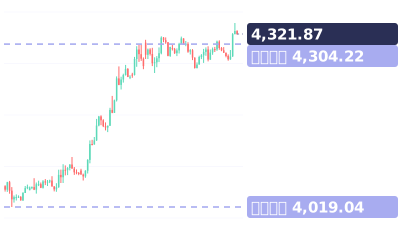
视频最后的小测验:黄金回到突破水平。该买入、跳过,还是先等?
视频完整旁白(英文原文)
Gold broke out, then came back to the level.
Buy the retest or skip it? The candle there decides.
Free daily picks in our app, link in bio.
Real gold, 1-hour chart. August 4, gold closed above 4,069.
On August 5, it came back to that level.
First candle there: small and red. No clear signal. Wait.
Next candle closed green at 4,082, above the level. That's your buy.
Stop under the recent lows, around 4,060.
Gold climbed past 4,300 the next day.
But if a candle closes back inside the old range, skip it. The breakout failed.
Save this. Green close at the level: buy, stop under it. Close back inside: skip. No clear candle: wait.
Your turn. Gold back at the breakout level. Buy, skip, or wait? Comment below.
Follow for one chart lesson every day.
go dot borearis dot com.
接着看


视频为 AI 配音,内容由 Borearis 研究团队撰写审核。仅供学习参考,不构成投资建议,交易有风险。