
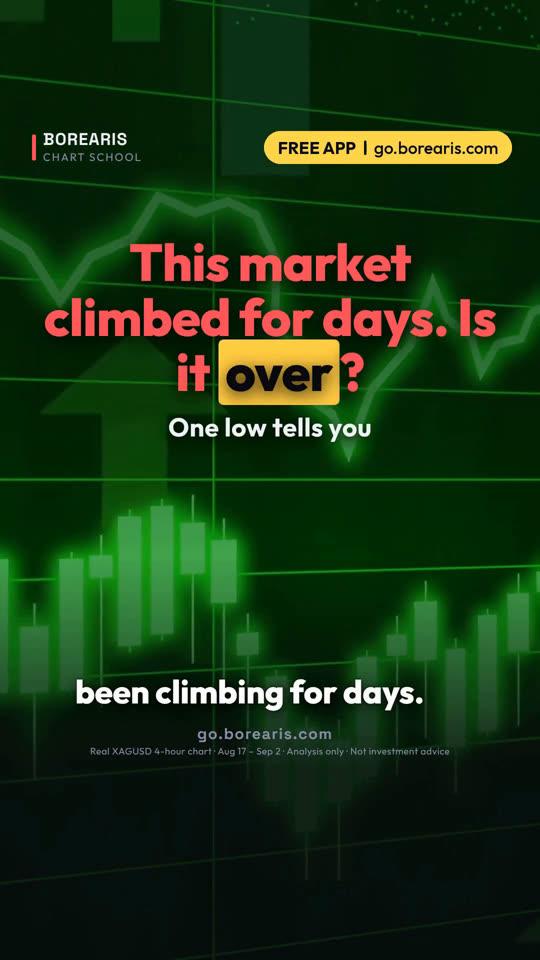

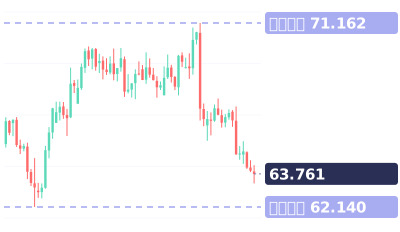
这堂课用的真实 K 线
Real XAGUSD 4-hour chart · Aug 17 – Sep 2
视频最后的小测验:上升趋势中出现一根大阴线,但收盘价仍在最近一个更高的低点之上。趋势结束了吗?
视频完整旁白(英文原文)
This market has been climbing for days. Is it over?
One low on this chart answers it.
This is silver on the four-hour chart. It climbed from 62.14 to 71.16 in under ten days.
Then this single candle made a new high, and closed all the way down at 66.96.
Check one: are the higher lows intact? Mark each low on the way up.
62.14, then 65.62, then 67.42, then 67.61. Each one higher. That's the uptrend.
The low that matters is the last one: 67.61.
Check two: did a candle close below it? This one closed at 66.96. Yes.
That's the first lower low. The chain of higher lows is broken.
So the answer: the uptrend is over, at least for now. If you were long, that was the exit.
Here's what happened. Silver kept sliding, down to 63.29 within five days.
Now the flip side. A big red candle that stays above the last higher low? The trend is still alive.
So don't panic on one red candle. Watch the last higher low.
Save this. Higher lows intact: still up. Close below the last higher low: it's over. Stop buying the dips.
Your turn. A big red candle in an uptrend, but it closes above the last higher low. Over or not? Comment below.
Follow for one chart lesson every day.
go dot borearis dot com.
接着看


视频为 AI 配音,内容由 Borearis 研究团队撰写审核。仅供学习参考,不构成投资建议,交易有风险。