


这堂课用的真实 K 线
Real XAUUSD daily chart · Oct 16, 2025 – Mar 30, 2026 · quiz: AUDUSD 4-hour
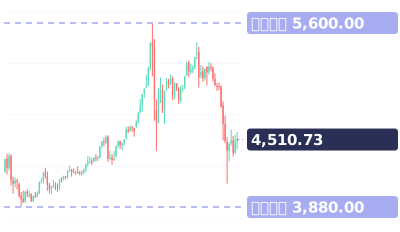
视频最后的小测验:看这张图上的低点。上升趋势还在、已经结束,还是不确定?
视频完整旁白(英文原文)
The uptrend looks strong. But is it still alive?
One thing tells you. Watch the lows.
This is a real gold daily chart, starting in October 2025.
Each dip stopped higher than the one before. 3,887, then 3,929, then 3,998.
Then 4,170, 4,274, and 4,537. Six higher lows in a row.
And each rally topped the last one. Higher highs plus higher lows: that's an uptrend.
How do you trade it? Buy pullbacks that hold above the last low.
Like this dip on December 31. It held at 4,274, above the 4,170 low before it.
Buy when it holds, with your stop just under that dip.
Then gold ran all the way to 5,598 in late January.
Now the warning. On February 2, gold dropped to 4,402.
That's below the last higher low at 4,537. The first lower low.
It doesn't mean sell everything. It means stop buying the dips.
Gold never got back above 5,598. On March 23, it traded down to 4,098.
Save this. Higher lows: trend alive. Dip holds above the last low: buy, stop under it. First lower low: warning.
Your turn. Look at the lows on this Aussie dollar chart. Still alive, over, or unsure? Comment below.
Follow for one chart lesson every day.
go dot borearis dot com.
接着看




视频为 AI 配音,内容由 Borearis 研究团队撰写审核。仅供学习参考,不构成投资建议,交易有风险。