
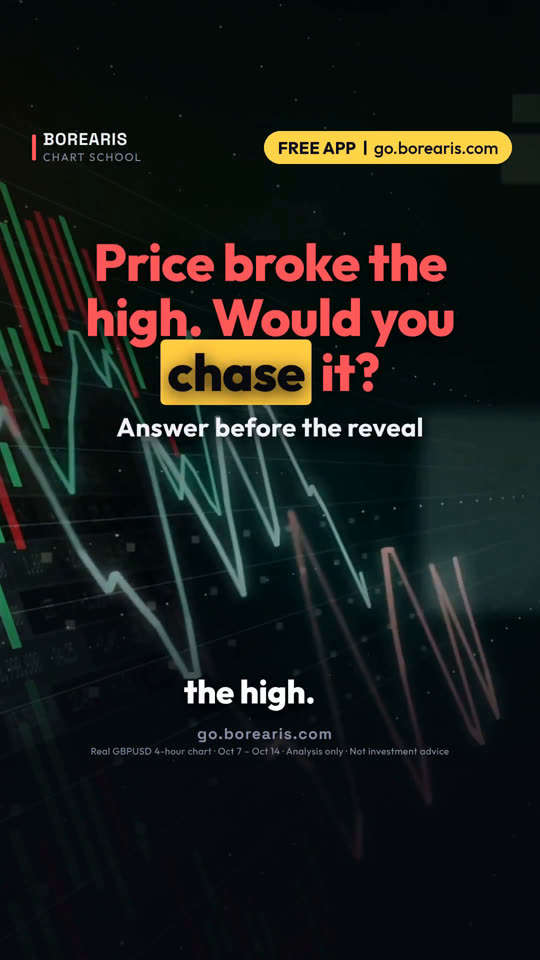
價格破高了,你會追嗎?
價格剛破高,你現在會買嗎?先定下你的答案,再看接下來發生什麼。
- 檢查一:K 線有沒有收在前高之上?只是勉強站上不算數。
- 檢查二:下一根 K 線有沒有守住這個價位?
- 檢查三:真正的突破會守住,或者回測後守住。這時才買進。
- 如果收盤又跌回前高之下:代表突破失敗。直接跳過。


這堂課用的真實 K 線
Real GBPUSD 4-hour chart · Oct 7 – Oct 14
影片最後的小測驗:價格收在前高之上,但下一根 K 線轉紅。該追進、先等,還是跳過?
影片完整旁白(英文原文)
Price just broke the high. Would you buy right now?
Lock in your answer. Then watch what happened next.
This is the pound on the four-hour chart. For days, it kept stalling just under 1.3263.
Then this candle closed above it, at 1.3274. Breakout?
Check one: did it close above the high? Yes, but only by about ten pips.
Check two: did the next candle hold above the level? You don't know yet.
Chase here, and your stop sits just under the old high. One bad candle takes you out.
Check three: a real breakout holds. Wait for the next close to stay above, or a retest that holds.
So the answer: don't chase. Wait one more candle.
Here's what happened. The next candle closed at 1.3261, back under the high.
That's a failed breakout. The candle after that closed at its low, 1.3203.
Four hours later, the pound hit 1.3136.
Anyone who chased at 1.3274 got stopped out fast.
Waiting cost nothing. The close back under the high told you to skip it.
Save this. Close above the high: step one. Next candle holds: real breakout. Closes back under: failed, skip it.
Your turn. Price closes just above a high, and the next candle turns red. Chase, wait, or skip? Comment below.
Follow for one chart lesson every day.
go dot borearis dot com.
接著看


影片為 AI 配音,內容由 Borearis 研究團隊撰寫審核。僅供學習參考,不構成投資建議,交易有風險。