
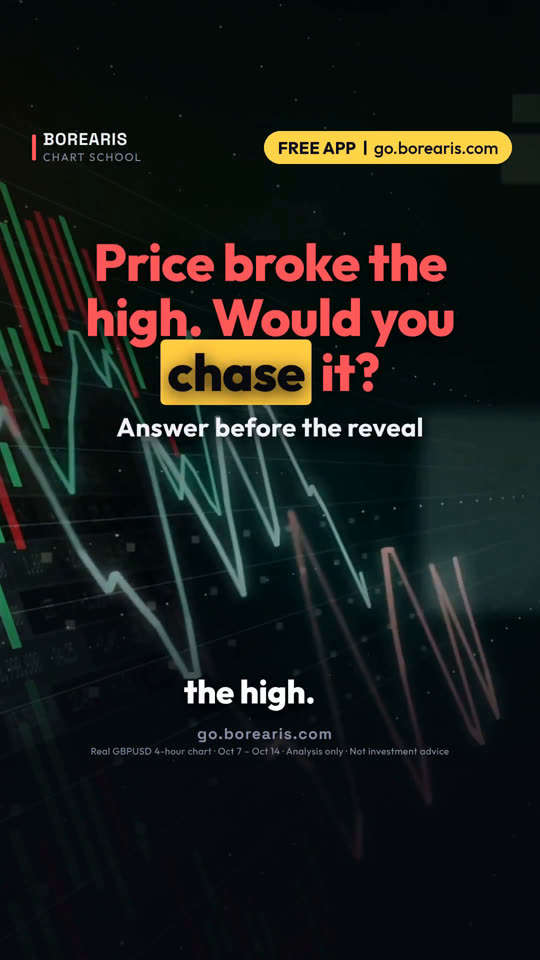
价格破高了,你会追吗?
价格刚破高,你现在会买吗?先定下你的答案,再看接下来发生什么。
- 检查一:K 线有没有收在前高之上?只是勉强站上不算数。
- 检查二:下一根 K 线有没有守住这个价位?
- 检查三:真正的突破会守住,或者回测后守住。这时才买入。
- 如果收盘又跌回前高之下:代表突破失败。直接跳过。


这堂课用的真实 K 线
Real GBPUSD 4-hour chart · Oct 7 – Oct 14
视频最后的小测验:价格收在前高之上,但下一根 K 线转红。该追进、先等,还是跳过?
视频完整旁白(英文原文)
Price just broke the high. Would you buy right now?
Lock in your answer. Then watch what happened next.
This is the pound on the four-hour chart. For days, it kept stalling just under 1.3263.
Then this candle closed above it, at 1.3274. Breakout?
Check one: did it close above the high? Yes, but only by about ten pips.
Check two: did the next candle hold above the level? You don't know yet.
Chase here, and your stop sits just under the old high. One bad candle takes you out.
Check three: a real breakout holds. Wait for the next close to stay above, or a retest that holds.
So the answer: don't chase. Wait one more candle.
Here's what happened. The next candle closed at 1.3261, back under the high.
That's a failed breakout. The candle after that closed at its low, 1.3203.
Four hours later, the pound hit 1.3136.
Anyone who chased at 1.3274 got stopped out fast.
Waiting cost nothing. The close back under the high told you to skip it.
Save this. Close above the high: step one. Next candle holds: real breakout. Closes back under: failed, skip it.
Your turn. Price closes just above a high, and the next candle turns red. Chase, wait, or skip? Comment below.
Follow for one chart lesson every day.
go dot borearis dot com.
接着看


视频为 AI 配音,内容由 Borearis 研究团队撰写审核。仅供学习参考,不构成投资建议,交易有风险。