


这堂课用的真实 K 线
Real BTCUSDT 1-hour chart · Oct 12 – Oct 13 · quiz: BTCUSDT 4-hour
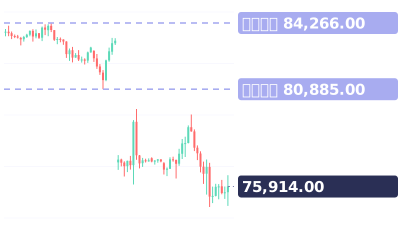
视频最后的小测验:比特币跌破后横盘整理。该做空、买入,还是先观望?
视频完整旁白(英文原文)
Bitcoin broke down, then went flat.
Short the stall, or wait? The next candles decide.
Real Bitcoin 1-hour chart, October 12. Support near 83,125 broke.
Then it went flat for hours, all below that line.
Flat under the broken level means sellers are still in control.
Don't short the middle of the stall. Wait for one of two triggers.
One: a failed retest. Price climbs back toward the line, and gets rejected.
Two: a new low. A close below the bottom of the stall.
Here, both happened. Bitcoin then dropped to 80,885.
And if it climbs back above the line, the breakdown failed. Don't short.
Save this. Flat below: sellers in control. Short a failed retest or new low. Back above: don't short.
Your turn. Another Bitcoin breakdown, then a stall. Short, buy, or wait? Comment below.
Follow for one chart lesson every day.
go dot borearis dot com.
接着看


视频为 AI 配音,内容由 Borearis 研究团队撰写审核。仅供学习参考,不构成投资建议,交易有风险。