
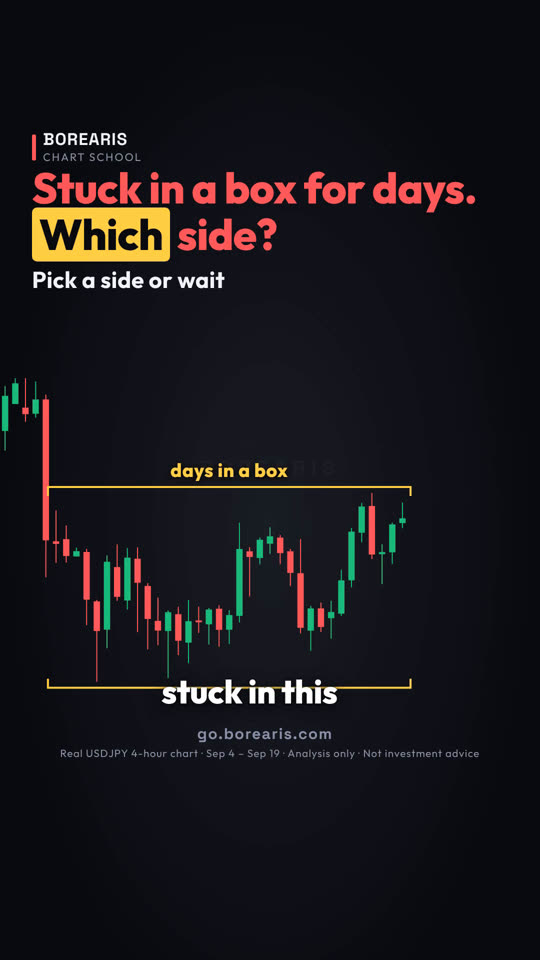
卡在箱子好几天,做哪边?
价格卡在这个箱子好几天了。你会买底部、卖顶部,还是等突破?
- 标出区间:一条线画在最高高点,一条画在最低低点。
- 做边缘,不做中间。止损放在区间外一点点。
- 影线戳出去不算突破。收盘在外才算。
- 收盘在外 = 区间结束了。不要再逆势做。


这堂课用的真实 K 线
Real USDJPY 4-hour chart · Sep 4 – Sep 19
视频最后的小测验:下次看到区间:买底部、卖顶部,还是等突破?
视频完整旁白(英文原文)
Price has been stuck in this box for days.
Would you buy the bottom, sell the top, or wait for the break?
Step one: mark the box. One line on the highest high, one on the lowest low.
Here, the top sits near 155, and the bottom near 152.9.
Step two: trade the edges, not the middle.
Near the bottom, you can buy, with a stop just below the box.
Near the top, you can sell, with a stop just above the box.
In the middle, there's no edge. Just noise. Stay out.
Step three: a close outside the box ends it.
A wick poking out is not enough. You need a candle that closes outside.
So what happened here? On September 15, one candle poked above the top, but closed back inside.
Two candles later, one closed above. Box over. Dollar yen then climbed to about 158.
If you sold the top, your stop above the box kept the loss small.
If you waited, that close outside was your signal to stop selling.
Save this. Mark the box. Trade the edges, stop outside. Middle, stay out. Close outside, the box is over.
Your turn. Next box you see: buy the bottom, sell the top, or wait for the break? Comment below.
Follow for one chart lesson every day.
go dot borearis dot com.
接着看




视频为 AI 配音,内容由 Borearis 研究团队撰写审核。仅供学习参考,不构成投资建议,交易有风险。