
趨勢還是區間?給你 5 秒
趨勢還是區間?你有五秒。看錯了,整天都會用錯策略。
- 波段高點和低點持續往同一方向推進,就是趨勢。做法是買回調,止損放在前一個低點下方。
- 高點和低點反覆落在相同位置,就是區間。做法是靠近底部買、靠近頂部賣。
- 在區間裡,止損放在區間箱體外側一點。
- 實例:EUR/USD 1H 10 月 22–26 日(區間 1.1185–1.1231),黃金 1H 8 月 20–24 日(趨勢)。


這堂課用的真實 K 線
Real EURUSD 1-hour · Oct 22 – Oct 26 · trend: XAUUSD 1-hour Aug 20 – Aug 24 · quiz: USDJPY 1-hour Oct 26 – Oct 28
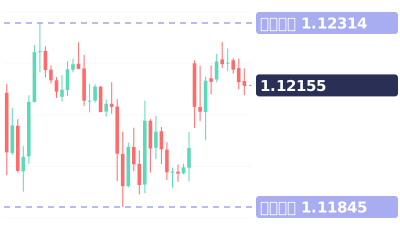
影片最後的小測驗:這一題:是趨勢還是區間?
影片完整旁白(英文原文)
Trend or range? You have five seconds.
Get it wrong and you'll use the wrong strategy all day.
Time's up. It's a range.
The highs stop at the same price, again and again. So do the lows.
In a range, trade the edges. Buy near the bottom, sell near the top.
Stops go just outside the box.
Now this gold chart. Every low is higher, every high is higher. That's a trend.
In a trend, don't sell the top. Buy the pullbacks, stop under the last low.
Save this. Swings stepping one way: trend, buy pullbacks. Same highs and lows: range, trade the edges.
Your turn. This one: trend or range? Comment below.
Follow for one chart lesson every day.
go dot borearis dot com.
接著看

影片為 AI 配音,內容由 Borearis 研究團隊撰寫審核。僅供學習參考,不構成投資建議,交易有風險。