
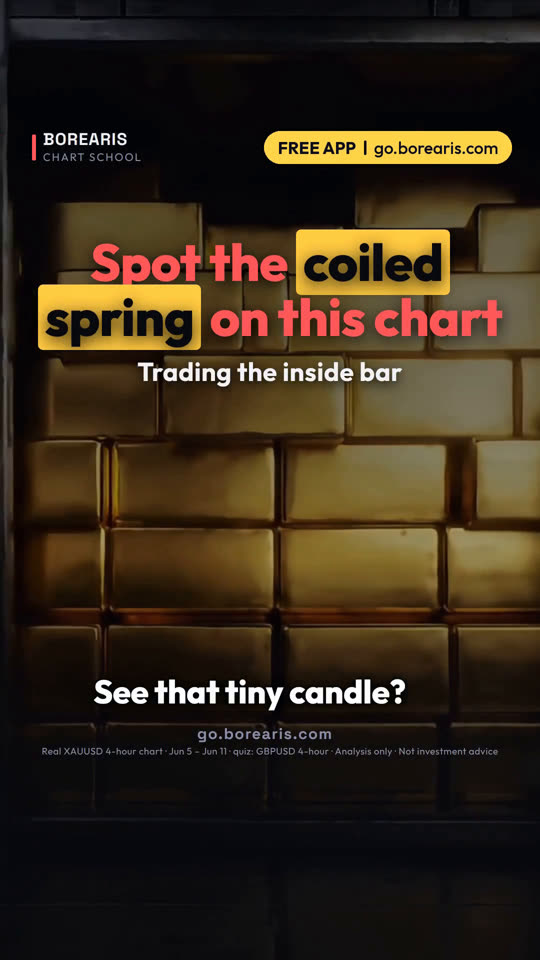

這堂課用的真實 K 線
Real XAUUSD 4-hour chart · Jun 5 – Jun 11 · quiz: GBPUSD 4-hour
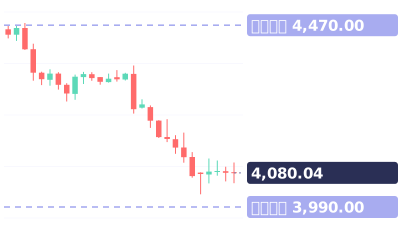
影片最後的小測驗:這是一根內包線。它會往哪邊突破:向上、向下,還是先觀察再說?
影片完整旁白(英文原文)
See that tiny candle? It's a spring being pressed down.
Here's how to trade it when it lets go.
It's called an inside bar. Its whole range, high to low, sits inside the candle before it.
This is a real gold 4-hour chart. On June 9, a big red candle.
Then this tiny candle, from 4,274 down to 4,250. Completely inside.
It's a pause. Buyers and sellers are both waiting. Nobody knows the direction yet.
So don't guess. Mark its high and its low, and let price choose.
The break shows the direction. Trade the side it breaks.
Here, the next candle broke below 4,250 and closed at 4,218.
That's the sell signal. Your stop goes on the other side, just above 4,274.
A tiny candle means a tight stop. That's what makes this setup useful.
The next day, gold dropped to 4,023.50.
If it breaks up instead, flip it: buy, with the stop below the low.
Save this. Inside bar: a pause. Mark its high and low. Trade the break, stop on the other side.
Your turn. Here's an inside bar on the pound. Which way does it break? Up, down, or wait and see? Comment below.
Follow for one chart lesson every day.
go dot borearis dot com.
接著看

影片為 AI 配音,內容由 Borearis 研究團隊撰寫審核。僅供學習參考,不構成投資建議,交易有風險。