

视频完整旁白(英文原文)
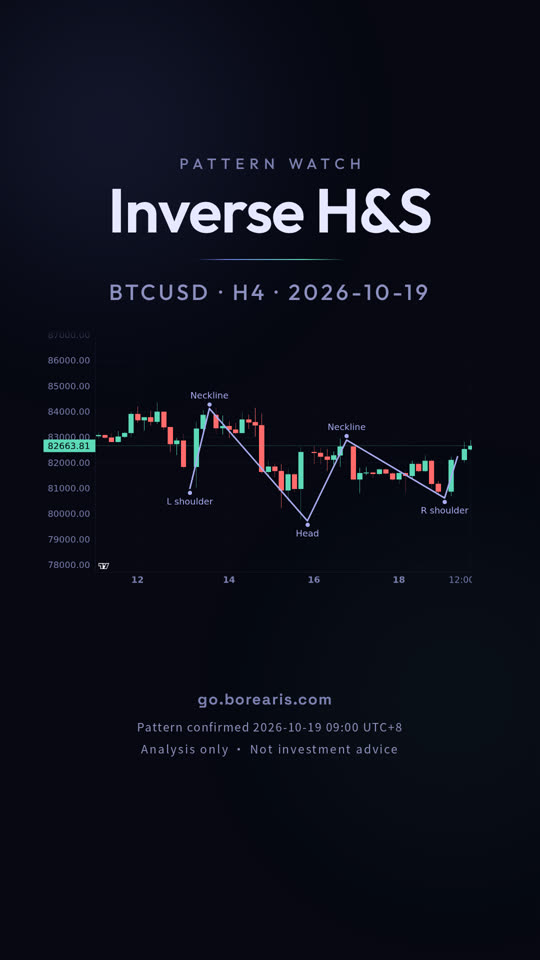
Bitcoin sank, sank deeper, then climbed back to where it started.
October 19: Bitcoin on the 4-hour chart, where an inverse head and shoulders confirmed today.
The pattern is a middle low that sits lowest, with higher, roughly level lows on each side.
Connect the highs to draw the neckline at 81910.9; confirmation needed a close above it.
From here, the measured target is 85398.2, and the invalidation level is 80460.0, where a close beyond it cancels the pattern.
It is still in play, and neither level has been hit.
A pattern never guarantees its target, and the same shape fails just as often.
go dot borearis dot com.
更多短片
接着看
视频为 AI 配音,内容由 Borearis 研究团队撰写审核。仅供学习参考,不构成投资建议,交易有风险。