


這堂課用的真實 K 線
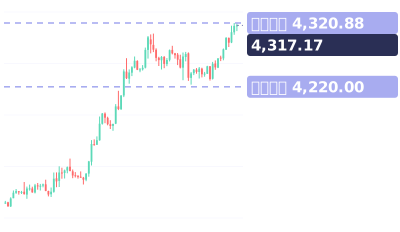
Real XAUUSD 1-hour chart · Aug 4 – Aug 7
影片最後的小測驗:你最常跳過哪個問題:止損、目標,還是趨勢?
影片完整旁白(英文原文)
Before you click buy, stop. Three questions.
If you can't answer them, don't take the trade.
Real gold chart, August 7. Price pulled back, and you want to buy at 4240.
Question one: where's my stop?
Under the last low at 4223. So, 4220. That's 20 dollars of risk.
Question two: where's my target, and is it at least twice the risk?
The last high is 4304. Target 4300, 60 dollars away. Three times the risk. Yes.
Question three: what's the trend on the bigger chart?
Zoom out. Since August 4, each day made a higher high and a higher low. The trend is up.
Three clear answers. Only now is the trade worth considering.
Price dipped to 4229 first. The stop held.
Later that day, it reached 4300.
Can't answer one? No clear stop, no room to the target, or the trend against you? Skip it.
Save this. Where's my stop? Is the target at least 2 times the risk? What's the bigger trend?
Your turn. Which question do you skip most? Stop, target, or trend? Comment below.
Follow for one chart lesson every day.
go dot borearis dot com.
接著看

影片為 AI 配音,內容由 Borearis 研究團隊撰寫審核。僅供學習參考,不構成投資建議,交易有風險。