
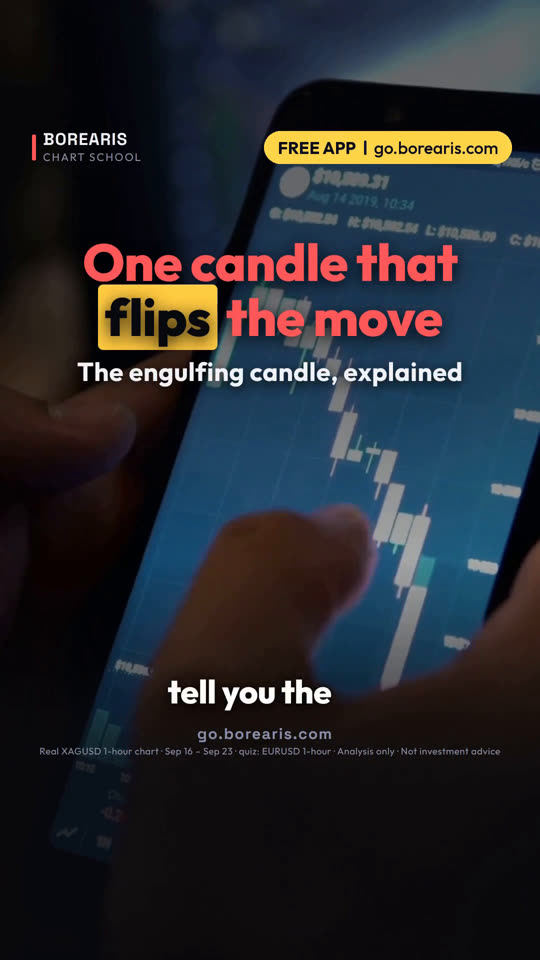

這堂課用的真實 K 線
Real XAGUSD 1-hour chart · Sep 16 – Sep 23 · quiz: EURUSD 1-hour
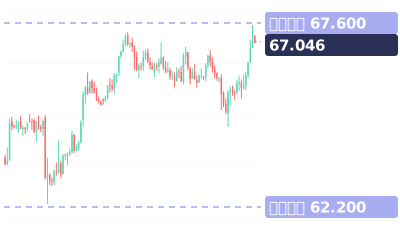
影片最後的小測驗:這根綠色 K 線算是真正的吞沒形態嗎?是、不是,還是不確定?
影片完整旁白(英文原文)
One candle can tell you the sellers just gave up.
It's called an engulfing candle. Here's how to use it.
Look at this real silver chart. On September 16, price kept stalling near 64.90.
Then it broke above that level and rallied to 67.32.
On September 22, three red candles dropped it straight back to that old level.
Then this green candle showed up.
Its body covers the whole body of the red candle before it. That's engulfing.
It closed above where the red candle opened. Buyers took back everything.
Rule one: the body must swallow the whole previous body. Wicks don't count.
Rule two: location. It's strongest after a clear move into a key level, like this old ceiling.
In the middle of a choppy range, the same candle means much less.
Rule three: enter only after it closes. Stop below its wick.
Here, that's an entry near 65.57, and a stop under 64.55.
The next day, silver traded above 67.50.
Save this. Body swallows the last body. After a clear move into a level. Enter on the close, stop beyond the wick.
Your turn. Is this green candle on the euro chart a real engulfing candle? Yes, no, or unsure? Comment below.
Follow for one chart lesson every day.
go dot borearis dot com.
接著看

影片為 AI 配音,內容由 Borearis 研究團隊撰寫審核。僅供學習參考,不構成投資建議,交易有風險。