
影片完整旁白(英文原文)
The S&P is caught between opposite outcomes, and the chart must decide.
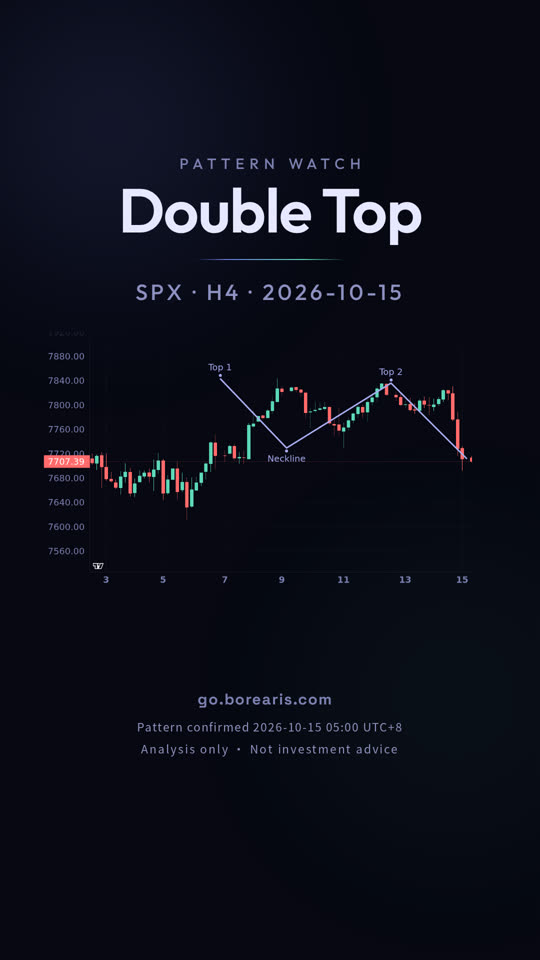
October 15, the S&P 500 on the 4-hour chart just confirmed a double top today.
A double top is price rejected twice from the same area. The low between those attempts is the neckline, and it only confirms on a close below it.
That close happened below 7729.5. From here, the measured target sits at 7615.5, while the invalidation level is 7848.0, where a close beyond it cancels the pattern.
It remains open, and neither level has been hit yet.
A pattern never guarantees its target, and the same shape fails just as often.
go dot borearis dot com.
更多短片
接著看
影片為 AI 配音,內容由 Borearis 研究團隊撰寫審核。僅供學習參考,不構成投資建議,交易有風險。