
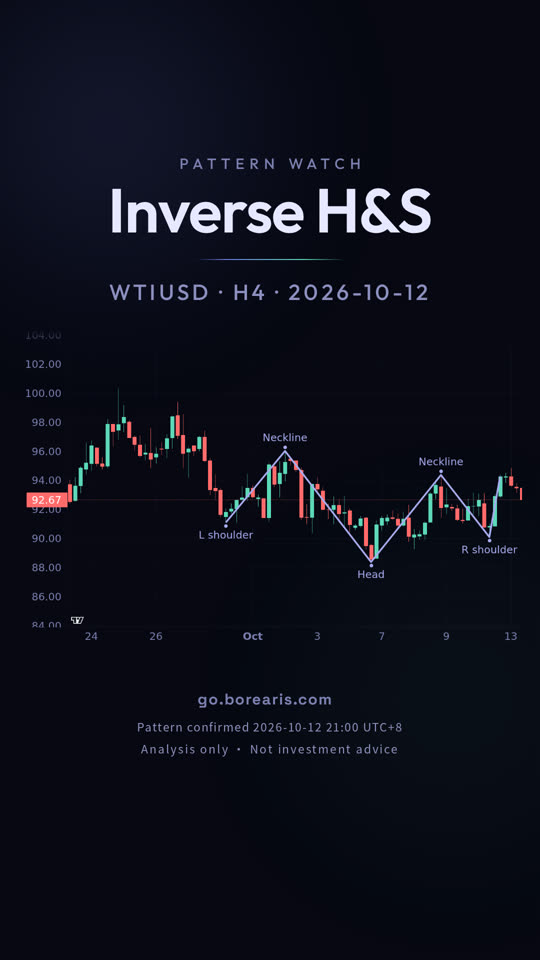
WTI原油 4 小時圖:頭肩底
WTI原油 4 小時圖出現頭肩底,看漲。影片一分鐘看懂這個型態怎麼認、在哪裡進場、止損和目標放哪。
- 型態:頭肩底(看漲)
- 進場 94.26、止損 89.79、目標 100.47

影片完整旁白(英文原文)
Crude oil just closed above the line that mattered.
October 13, this is crude oil on the four-hour chart, and an inverse head and shoulders confirmed yesterday.
That pattern is three lows, with the middle low deepest and the two outer lows higher and roughly level.
Connect the two highs between them to draw the neckline. It only confirms on a close above that neckline, which happened at 93.74.
The measured target is 100.47, and the invalidation level is 89.79. A close beyond it cancels the pattern.
The setup is still in play. Neither level has been hit yet.
A pattern never guarantees its target, and the same shape fails just as often.
go dot borearis dot com.
接著看
影片為 AI 配音,內容由 Borearis 研究團隊撰寫審核。僅供學習參考,不構成投資建議,交易有風險。